Beyond Likes and Comments: What Social Data Really Contains
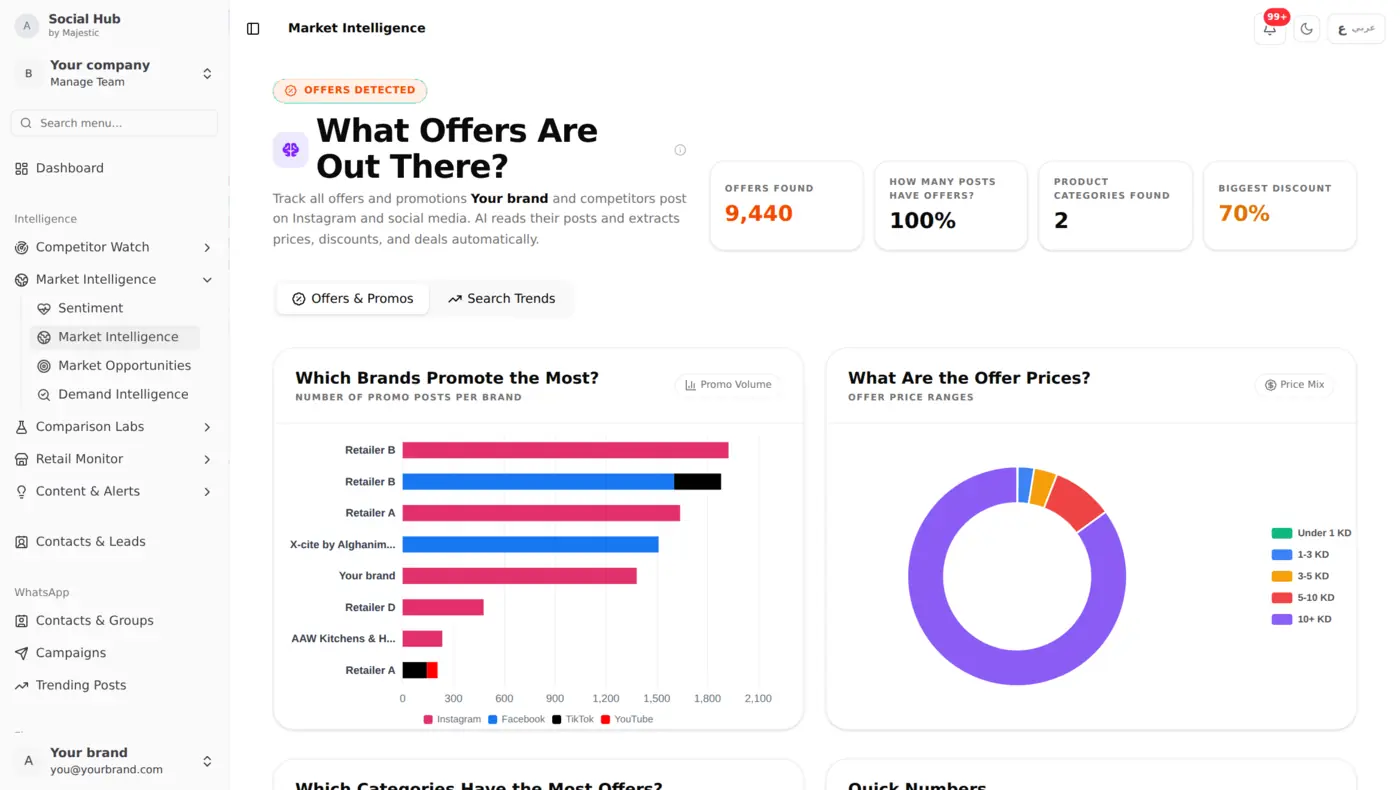
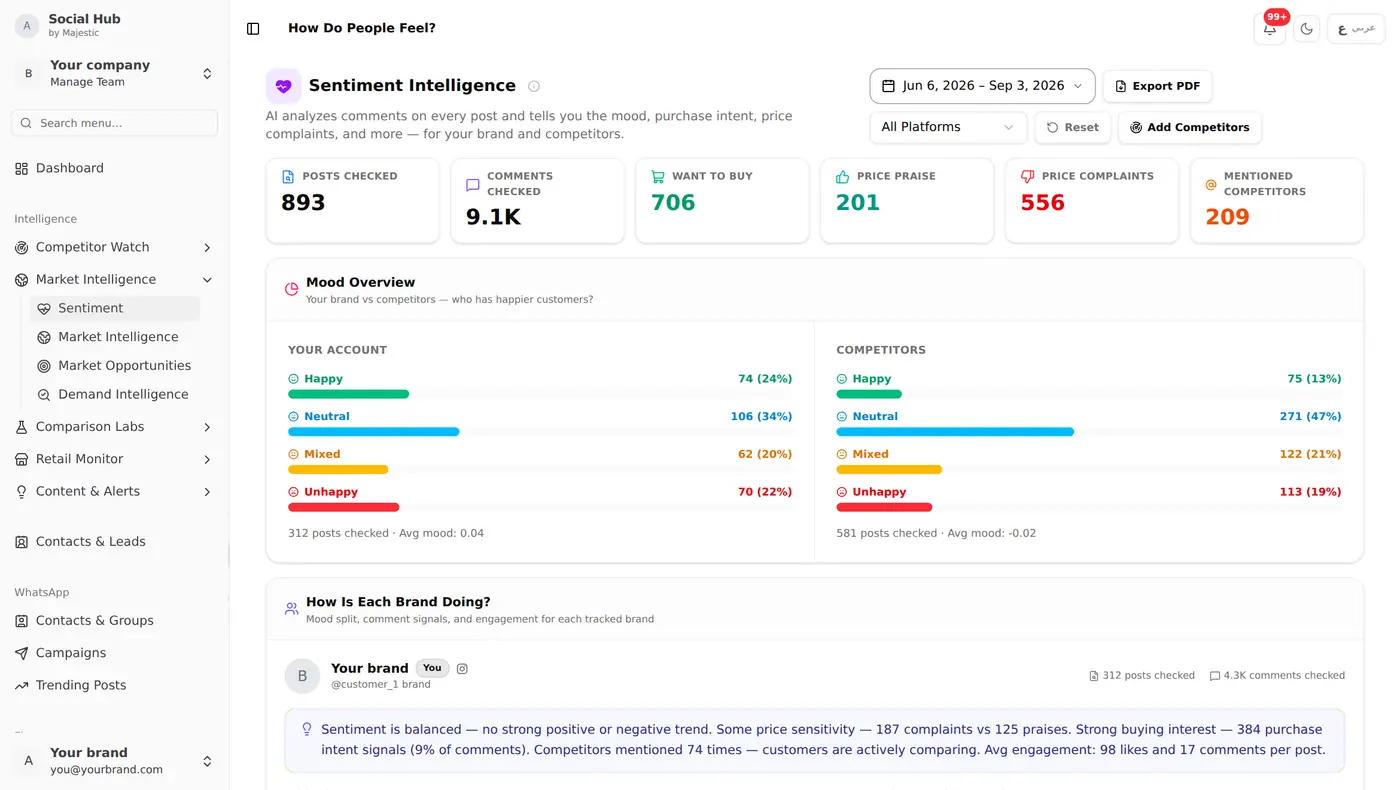
When a competitor posts about a product, the engagement it receives IS market research: just in raw form. 500 likes on a post for Brand A vs. 50 likes on a post for Brand B tells you something about demand. Comments asking "what's the price?" or "do you deliver?" are purchase intent signals.
Social Hub's Demand Intelligence system extracts these signals and turns them into actionable market opportunities. Combined with electronics price monitoring, it gives retailers a complete view of both supply and demand.
How Demand Intelligence Works
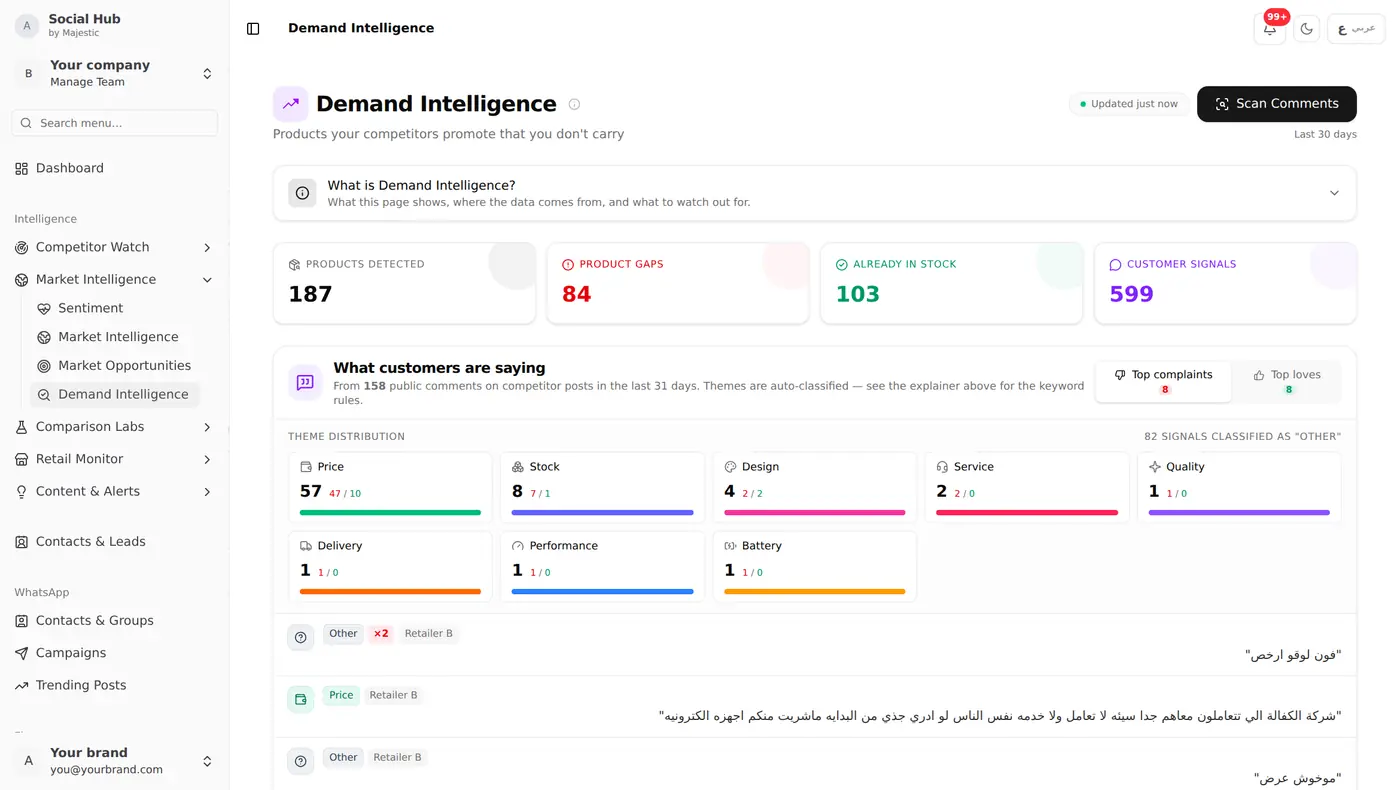
Here's the Demand Intelligence dashboard in action: tracking products across competitors, surfacing what customers are actually asking for and complaining about:
Signal Extraction
From every competitor post, we extract:
- Product mentions, what specific products are being promoted
- Engagement volume, likes, comments, shares
- Comment intent, purchase inquiries, product requests, complaints
- Posting frequency, how often a product gets promoted
Demand Scoring
Each product gets a demand score based on:
- Customer requests in comments
- Cross-competitor presence (how many brands promote it)
- How often it appears in competitor posts
- Total engagement on those posts
- Momentum (rising, stable or falling)
Google Trends search interest is shown alongside for context, but it isn't part of the score.
Opportunity Identification
The system identifies gaps:
- Products competitors promote, or customers ask for, that you don't carry yet
- Products where demand is rising
- Price points that generate the most engagement per product category
The Price-Engagement Quadrant
One of our most powerful views plots every tracked product on two axes:
- X-axis: Price point
- Y-axis: Social engagement
This reveals four quadrants:
- High price, high engagement: premium products with proven demand (cash cows)
- Low price, high engagement, value products driving foot traffic
- High price, low engagement, overpriced or poorly marketed
- Low price, low engagement: commodities (compete on distribution, not social)
What You Can Do With It
Track the electronics retailers you compete with, and Demand Intelligence shows you which products they keep promoting, which ones draw the most engagement, and where customers ask about price or availability in the comments. Market Opportunities ranks the products you don't carry yet, with a clear breakdown of why each one scores high, so your buying team can decide what to stock next.
Product Battle: Head-to-Head Comparison
Product Battle takes this further: pick a product and compare your data with each competitor side by side:
- How often each competitor promotes it, and at what price
- How many customer inquiries and purchase signals it draws
- Comment sentiment for each account
- Likes, comments, views and shares on each post
Getting Started with Demand Intelligence
- Track at least 3-5 competitors in your industry
- Wait 2-4 weeks for data to accumulate
- Open Demand Intelligence dashboard
- Open Market Opportunities, ranked by opportunity score, to find your biggest wins
The more competitors you track and the longer you track them, the more accurate the demand signals become.